Insights on plastic waste in Udaipur, India: The importance of data in building circular solutions
-

-
Umesh Madhavan
-
November 2, 2022
-
5 min read
Umesh Madhavan
November 2, 2022
5 min read
Preparations are underway to begin negotiations on the details of the first international legally binding instrument to end plastic pollution. While the world prepares to turn its attention from pledges to implementable actions, it is crucial that decisions are based on a thorough understanding of the plastic pollution problem. As underlined in the draft resolution adopted by the United Nations Environment Assembly, “strengthening scientific, technical and technological knowledge with regard to plastic pollution” will be essential to advancing the work of the global partnership.
Research has shown that plastic pollution largely stems from cities and rapidly urbanizing communities throughout the developing world, with 80% of plastic waste originating from land-based sources and more than half from urban centers.* The available data indicates that the potential for impact in cities is significant, yet we lack the level of detail needed to determine where best to deploy solutions.
Filling data gaps to achieve circularity
The Closing the Data Gap Challenge, supported by The Circulate Initiative and the Alliance to End Plastic Waste with WASTE and FINISH Society as local research partners, is an initiative designed to support decision-makers and other stakeholders with better quality data to help prevent plastic pollution and advance a more inclusive, circular economy. Initiated in 2021, the project called for submissions from the research community to conduct studies in selected key cities across India, Malaysia, and the Philippines.
The selected project focused on the state of plastic waste generation and management in Udaipur, India. Often referred to as the “City of Lakes,” Udaipur is situated in the northwestern state of Rajasthan. It has a diversified economy, serves as a market center for smaller towns of the region, and is also a tourist location, with a high number of local and international tourists visiting each year.
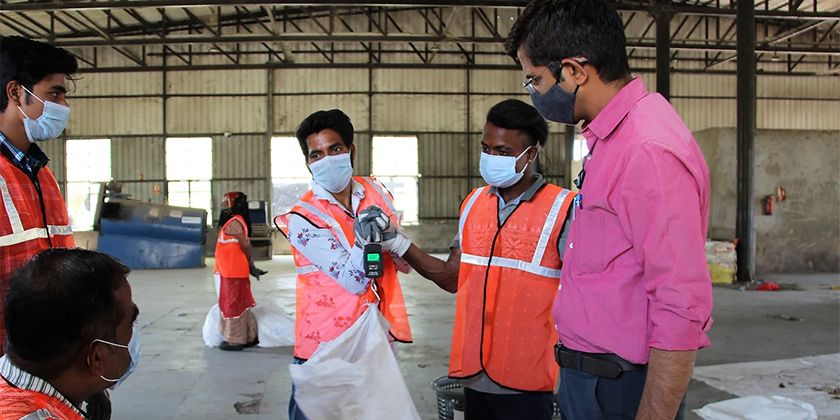
The study was undertaken leveraging both primary and secondary research. This included characterizing household-level waste using the Waste Wise Cities Tool (WaCT) guidelines (developed by UN Habitat), as well as site visits to a transfer station, material recovery facilities, a waste treatment plant, and a waste disposal site. Finally, interviews were undertaken with various ecosystem actors, including informal waste workers. The results from the study provide comprehensive baseline data which can be used to strategically design solutions to address plastic waste leakage in the city.
Select key findings
Plastic accounts for 10% of household waste generated
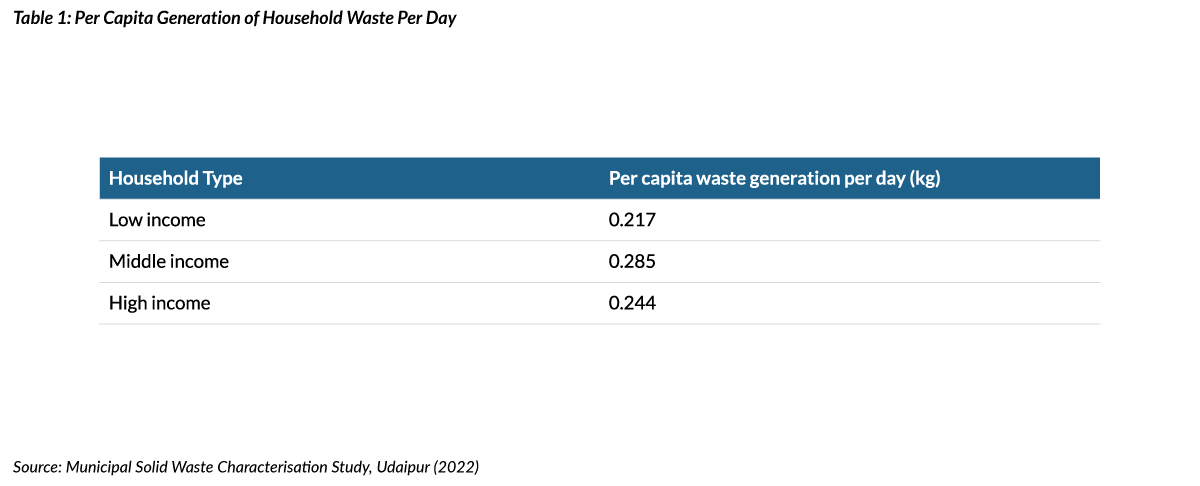
Daily per capita household waste generation for the city was estimated at 0.261 kg. Of the total household waste generated, organic waste accounted for nearly 65%, plastic 10%, paper/ cardboard approximately 5%, and others, including glass, metal, and other items the remaining 20%. The study found that waste generation differs among families of different income levels due to different consumption behaviors (Table 1).
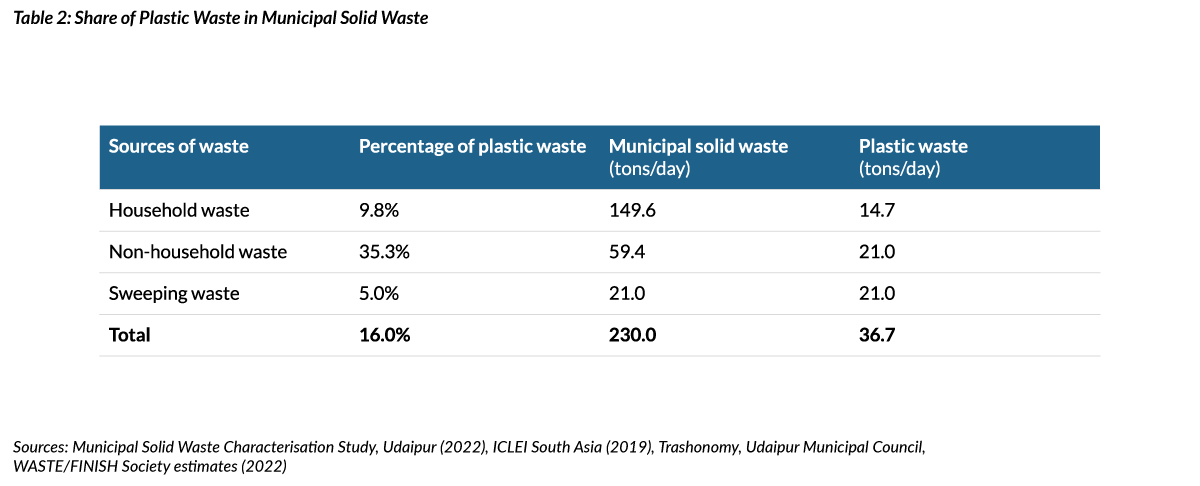
The majority of plastic waste is from commercial entities such as hotels, markets, and restaurants
Across household and household-similar entities (hotels and restaurants, other commercial places, Institutions, vegetable markets), the study also found that 230 tonnes of municipal solid waste were generated daily, with the majority coming from households. However, the use of plastic and the resulting share of plastic waste from household-similar entities was higher at 35% compared to households (Table 2).
Informal waste workers – a key contributor to plastics recycling
A vital informal plastic waste value chain exists in Udaipur, where informal workers are the primary collectors of recyclable plastic waste. They collect plastic waste not only from the waste disposal site but also from houses, commercial establishments, and from the streets. Considering the significant role they play in the municipal solid waste management system, it is evident that municipalities must take a holistic approach to improve the conditions of informal waste workers alongside waste management strategies (Figure 1).
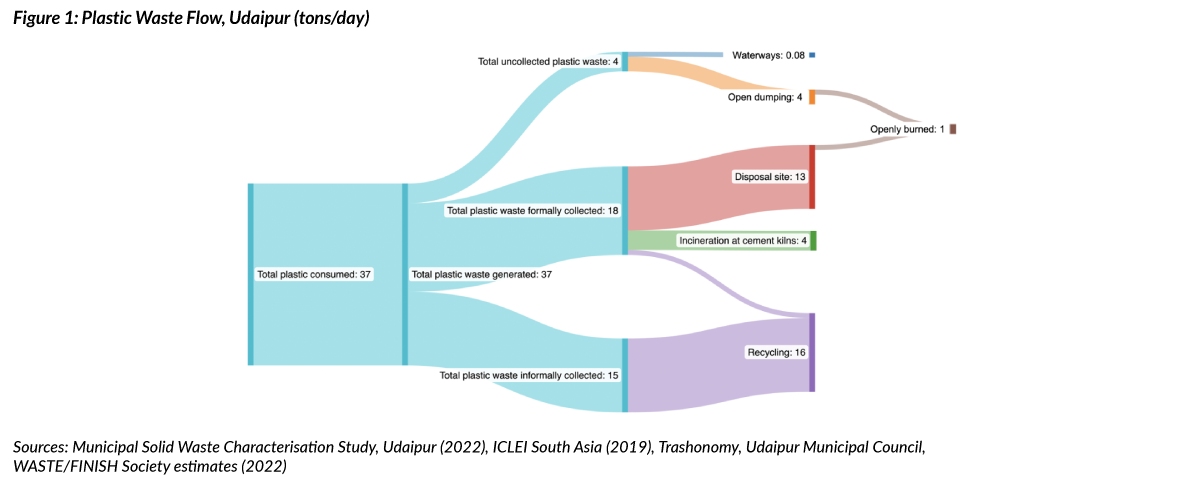
In conjunction with the integration of the informal waste worker community, the study concluded that strategies such as improving source segregation by households and commercial entities and utilizing digital tools for data monitoring of waste flows, should also be considered to improve plastic waste collection and recycling in the city.
Actionable insights to reduce plastic leakage and develop plastics circularity in Udaipur
Following the study, a workshop was hosted to review the data and explore possible actions for local government. Behavior change campaigns for plastic waste segregation at the household level, improving collection infrastructure, training on types of plastic, and possible low-cost recycling methods were all identified as potential actions.
Importantly, successful efforts to combat plastic pollution in any city or urban center will rely not only on the availability of consistent data, but also on collaborative efforts from key stakeholders, including national and local governments and the public sector. It is our hope that studies like this can set a precedent for obtaining meaningful data on plastic pollution within a city and urge similar efforts to be replicated to address the existing and in many cases, widening data gaps.
References
*Eunomia Research & Consulting (2016) Plastics in the Marine Environment Available from: http://www.eunomia.co.uk/reports-tools/plastics-in-the-marine-environment/